
Over the past decade, I've watched the idea of “connected data” evolve from a futuristic buzzword to a survival skill for businesses and professionals. Today, unified analytics feels almost expected. Yet, for many, the real methods and logic behind those seamless dashboards and instantaneous reports remain mysterious. After talking to dozens of business owners, analysts, and even some non-tech coworkers, I realized what most are craving is a practical, low-jargon guide to how data connectors fit into this puzzle in the real world—without assuming everyone can code or has IT on speed dial.
So, I'm laying out here what I wish someone had explained to me when I first ran into the frustration of juggling CRM exports, payment processor spreadsheets, and project management charts.
Making your data “talk” is not just a technical trick—it's a business advantage you can claim, starting now.
What is a data connector, really?
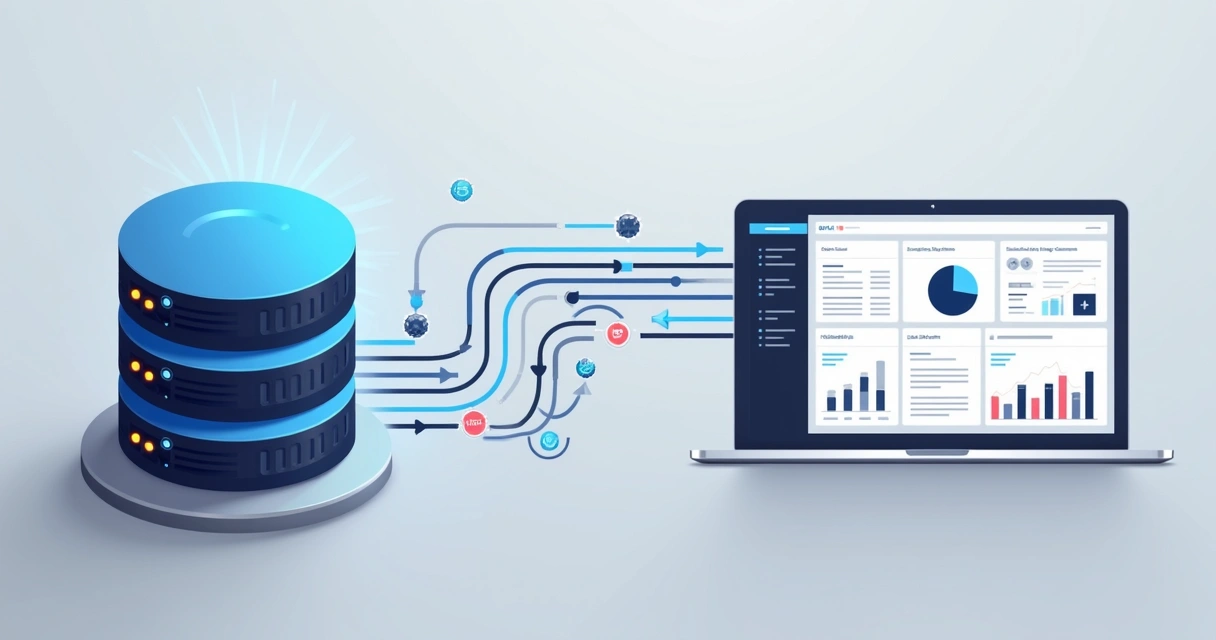
At its simplest, a data connector is any tool (software or service) that links one data source—such as an app, a database, or an external service—to another location, like a spreadsheet, a business dashboard, or a data warehouse. There are many flavors, but their main goal is the same:
A data connector lets information flow automatically between services, so you don’t have to copy, paste, or manually import files every time you want updated numbers.This may sound technical. But you don’t have to start out with any coding knowledge. I certainly didn’t. Today’s best connectors, like what Octobox specializes in, run on AI-powered and no-code or low-code setups. Most rely on simple steps: choose your source (like your CRM solution), pick your destination (maybe your favorite dashboard), and decide how the data should be matched up and presented.
What surprised me early on is that behind every “live” sales chart, customer report, or marketing dashboard you see in any thriving business, there’s almost always a connector working behind the scenes. It acts like a bridge—or, perhaps, a universal translator.

But is connecting services really enough? Or is there something deeper at play in how connectors help us bring meaning to our daily work?
How unified analytics transforms daily business decisions
I want to be honest—the first time I set up a connector, my attention wasn’t on business strategy or company growth. I just wanted to stop wasting time on tedious data downloads. What I discovered over time, though, was how quickly unified analytics changes the way you think and act at work.
- You see patterns sooner. When your payment processor and CRM “talk,” you catch changes in buying behavior almost instantly.
- Numbers become trustworthy. When dashboards pull live data from your main systems, you don’t double-check against last week’s spreadsheet. You trust what’s on screen.
- Reporting gets faster—and more confident. No more “let me export and clean the data first.” It’s just there.
- Compliance becomes easier. For many, audit trails and privacy rules are baked in when data is retrieved and updated in one controlled flow.
I noticed even a small team can act bigger and make sharper decisions with unified analytics. I’ve seen owners spot sales dips before they hit the bottom line, and marketers catch the early success of a campaign before it’s “officially” over.
You don’t need a data scientist for any of this. Actually, according to the UNECE’s 2017 guide, organizations that integrate data from multiple sources see a measurable boost in both quality and relevance of their stats.
Unified analytics shrinks the gap between seeing a trend and acting on it.
Types of data connectors: API, database, and custom built (with less or no code)
The first question I ever had about connectors was, “Are they all the same?” In my experience, they’re not. Most fall into three broad buckets: API connectors, database connectors, and custom options—often powered by no-code or low-code tools.
API connectors: The “official handshake” between software
API connectors use the “doors” that modern software services expose for exchanging data—called APIs, or Application Programming Interfaces. If you’ve used anything that lets you “sync” with an outside app, you likely relied on an API connector.
API connectors provide robust, secure, and structured ways to move data between approved platforms with little human effort.For example, let’s say your CRM offers an official API. A connector can automate pulling up-to-date leads into your dashboard every hour. Or sync contact data into your project management tool. These usually just require a login and a few clicks.
API connectors are very standardized. They give clear “yes” or “no” answers about what can be transferred. But sometimes, the rigidity leaves a bit less room for custom tweaks.
Database connectors: When the raw data matters most
If your data is sitting in a database (like a SQL server or a cloud database), there’s a special class of connectors just for you. These reach directly into the storage layer of your org’s knowledge—tables, rows, columns—and pull large amounts of info at once.
Setting up a database connector might sound intimidating, but today’s tools often shield you from most of the code. You may point and click, grant access, and configure a schedule. Suddenly, you’re funneling every new customer order or support ticket into an analytics app with no more downloads.
This type of connector is a lifesaver when performance and completeness are non-negotiable. You get all the data, every time, ready for further steps.
Custom and AI-driven connectors: Removing the technical barrier
Now, here’s where things have changed the most in the last few years. Not long ago, if nothing else fit your integration needs, you either had to code a new connector or pay a consultant. But thanks to advances in AI and user-friendly interfaces, custom connectors are now more accessible than ever.
These “smart” connectors rely on a different logic. You may just describe, in plain language, what data you want to see and where. The system figures out how to get it, map it, and present it.
AI-powered connectors, like those offered by Octobox, let you describe your goal (“I want to see all sales orders from my shop and CRM combined in one table”)—and get results without any code.The benefit is huge: No developer bottleneck. No endless waiting for IT. Just actionable data, built your way, in a few clicks.
But beyond setup, these connectors keep their promise of privacy and exclusivity. In my research, I found that projects most trusted by business owners almost always focus on privacy as key—limiting access to connected data to just you and your team.
Custom connectors are breaking the myth that data integration is only for techies.
Why automation and real-time connections matter for smarter analytics
If you’re anything like me, you’ve spent way too much time waiting for the “monthly report.” Maybe you’ve even surfaced a key insight, then realized your data was already out-of-date.
Here’s where connector-driven automation really shines:
- Eliminates manual errors. Automated flows mean no more missed updates, version mismatches, or copy-paste mistakes.
- Keeps everyone aligned. A “single version of truth” lives in the dashboard—no more “which spreadsheet should I use?”
- Shortens decision cycles. Real-time or scheduled refreshes mean decision makers always have a fresh picture, not stale data.
- Unlocks new analysis. You can set triggers to update KPIs, launch alerts, or sync with follow-up actions as soon as the data changes.

A workshop summary by the Federal Committee on Statistical Methodology shows integrating survey data with auxiliary sources doesn’t just speed up analysis—it actually sharpens the usefulness of all statistical products.
If your business decisions rely on fast, accurate feedback, automation and real-time integration are your “always-on” power tools.The hands-on benefits: Real, practical wins for businesses
Talking with real users and clients over the years, I’ve noticed certain themes come up again and again when connectors start powering analytics:
- Time savings. Automated integration cuts hours (not just minutes!) from daily, weekly, or monthly reporting.
- Better data accuracy. When machines move the data, you lower the risk of typos and inconsistencies, getting closer to the real story every time.
- Security and privacy. Fenced, encrypted connectors mean data doesn’t “leak” during transfers, and the system logs who accessed what, when.
- Peace of mind for non-technical staff. The interface does the heavy lifting. Stakeholders don’t need to learn queries or deal with raw files—they just see the output.
Here are three examples where connectors unleash new kinds of value, especially for those who lack tech expertise:
Example one: The dashboard that shows everything (finally)
Imagine you’re in sales or management. You want a live-updating dashboard with numbers from your CRM, website, and payment app. In the past, you’d have to ask IT every time. Today, a proper connector lets you link all three, blending customer names, last purchase dates, campaign conversion rates, and even special comments—right there in your dashboard. You choose what to display. Sometimes, it’s ready in an afternoon.
This used to be the stuff of big budgets and larger teams. Now, it’s table stakes, and Octobox is one of the options leading this low-barrier approach.
Example two: Unified CRM and support for customer magic
A client of mine in retail once struggled to connect their online order system to customer service tickets. As a result, service reps couldn’t see the whole customer journey. By connecting these two with a ready-made, AI-driven tool, they fixed this overnight. Now, every support interaction can reference the latest order, status, and even prior feedback.
Example three: Payment processor meets finance tool
Finance teams live in (and fear) spreadsheets. By connecting payment provider data straight to the accounting dashboard, you get live-reconciled numbers—for payouts, returns, and cash flow projections. No more chasing down last month’s CSV. No extra plugins or coding.
The U.S. Geological Survey’s Community for Data Integration highlights that advancing cross-platform data practices empowers not just science, but everyday business reliability and creativity.
Connectors shrink reporting bottlenecks, build trust in your numbers, and make your team feel bigger—even if it’s just you.Low-code and no-code integration: Goodbye to technical barriers
One of my favorite stories comes from a marketing manager who, with no code background, combined leads from two separate platforms—within minutes. She just described the view she wanted, picked two apps, and let the AI-driven connector map fields accordingly.
This is a great example of where tools like Octobox change the game. Instead of fighting workflows, you speak your needs. Low-code and no-code experiences let you click, drag, and describe—no more scripting or bug fixing required.
- No IT bottlenecks—launch and edit integrations on your schedule.
- Version control is automated, reducing confusion about which logic is running.
- Most importantly, when you change your business process, your integrations update just as fast.
You don’t need to code to bring your data together.
I’ve been impressed with how even legacy sources—like spreadsheets and CSV files—can be linked to newer services. There are business cases highlighted in the International Statistical Institute’s conference on Statistical Data Integration that demonstrate how combining legacy and new data sources brings new life to classic reporting systems.
This connects well with my broader interest in integration best practices, especially for growing companies who want to remain nimble while expanding their reporting needs.
Privacy and confidentiality: Who sees your data?
Sometimes, business owners hesitate to connect systems because they’re worried: if an app sees everything, who’s making sure only trusted people can access it? I understand the concern.
The good news is, the best connectors today—from self-serve to full-service—take privacy seriously. When evaluating solutions, I look for:
- End-to-end encryption, both when data moves and when it sits.
- Permission settings that let you choose—down to the field or record—who gets to see what.
- Audit trails, so you have a log of when the data was accessed, pulled, or changed.
- Informed consent and GDPR-friendly policy designs.
Companies like Octobox stand out for giving customers the comfort that only they and their approved teams can view pulled data. No snooping, and no risk of accidental “oversharing.”
Modern connectors are built around privacy by design, not just as an afterthought.I’m not exaggerating when I say this is the linchpin for many regulated businesses, or anyone who cares about customer trust.
Common cases you can set up (without being a developer)
Maybe you’re wondering what you can build with a connector, if you’re not technical? Here are templates that keep coming up in my work:
- Sales dashboards with live data blending CRM, payments, and marketing analytics.
- Customer service boards combining support tickets and order history, so agents see the “whole picture” every time they log in.
- Finance snapshots uniting transaction records (from multiple banks, cards, and sales channels) for better cash management.
- HR and payroll tracking that merges attendance, performance, and compensation data, even across third-party platforms.
- Custom reports for compliance, where you bundle just the fields or records needed for each audience (like auditors, or investors).
If you’re new to this, I’d recommend looking at some real scenario breakdowns in this Octobox use-case article and the broader data visualization strategies directory.

Choosing the right connector: What I always consider
It took me a while to understand that not every solution is a fit for every scenario. Here’s my own checklist for picking the right connector (and I rarely skip a step):
- Integration scope: What systems do I need to unify? Are they apps, databases, or a mix?
- Transformation needs: Does my data need to be cleaned, merged, or visualized a certain way before it’s ready?
- Privacy/confidentiality: Which stakeholders will see the integrated info? What access control do I need?
- Scalability: Will my workflow grow? Can this tool add sources, destinations, or more data volume over time?
- User experience: How easily can my non-technical staff (or even myself on a busy day) set things up and keep them running?
- Support and reliability: If something breaks, can I get fast help? Are updates frequent and clear?
For inspiration on how a hands-on approach to data connectivity impacts long-term business improvement, I suggest checking out a resource like this Octobox productivity guide. You’ll see patterns in what matters long-term versus what can be solved quickly.

For more structured learning, the Harvard government data science program gives some great grounding in how and why we blend data for real analysis.
Conclusion: Owning your unified analytics future
Through all the changes I’ve seen in software and business over the years, one thing stands out—those who connect their data see the world more clearly, spot trends sooner, and make moves with more confidence. Gone are the days when you needed an IT army just to sync your sales with your customer list, or your payments with your product returns.
Tools and services like Octobox are putting this power in the hands of anyone determined to work smarter. With AI-driven setup, strong privacy, and low-code or no-code approaches, the old obstacles just don’t hold up anymore.
So, whether your priority is faster reporting, cross-functional teamwork, or bulletproof privacy, the route forward is open. If you want to see some more advanced use cases, I invite you to look at examples of integrated analytics in practice—and maybe get inspired for your next step.
I think now is the perfect time to take charge of your data story. If turning raw numbers into actionable insight sounds like the edge you need, consider trying Octobox—or just reaching out to learn what’s possible. Your connected data journey can truly start today.
Frequently asked questions
What is a data connector used for?
A data connector is used to link two or more data sources together, allowing information to flow automatically between them without manual intervention.Examples include syncing customer lists from a CRM with your sales dashboard, integrating order data from payment processors with finance tools, or bringing together data from various apps to create unified reports. This integration helps you see the whole picture in one place and react quickly, without having to export or merge files by hand.
How do I set up a data connector?
Setting up a data connector is typically a step-by-step process and doesn’t always require technical knowledge. Usually, you log in to your chosen tool, select which source and destination you want to connect (for example, your CRM and sales dashboard), configure which data fields to match, and schedule how often data should sync. Modern services, like those powered by AI (such as Octobox), may even let you describe what you need in natural language, guiding you through a no-code setup so you just point, click, and integrate.
Are data connectors secure for analytics?
Data connectors today are built with strong security in mind, often using end-to-end encryption, access controls, and detailed audit logs.Security depends on the provider, of course, but reputable solutions keep your data private and ensure only authorized users can access or edit connected data. Many also comply with privacy standards like GDPR, especially for sensitive or regulated environments.
What are the top data connector tools?
There are a number of respected tools on the market for integrating data, but my current experience has been most hands-on with Octobox. What makes it stand out is its focus on AI-driven, no-code usability that even non-developers can handle. It prioritizes data privacy and lets users (and only their chosen teams) see the integrated information. For further specific guidance, you might look into resources about integration tools and strategies for business reporting and analytics.
Can I build my own data connector?
Yes, you can. Especially now, with the rise of no-code and low-code platforms, building your own connector is more accessible than ever. Tools like Octobox allow you to define what you want by simply describing your needs. If you’re comfortable with APIs or databases, you can get more granular and set up your own, too. But for most, today’s frameworks mean you won’t need to write a single line of code, making custom connections practical for almost anyone.